Nevada Format - Field Data Analysis
Shippment & Field data
Shippment & Field data
Most organizations keep track of shipments, counting the number of products shipped to customers on a monthly basis. We need this information in order to compare it to the number of returns in order to estimate failure rates, and the number of units that have not failed.
When a unit is returned we count it as a return for the specific month was it manufactured. This allows us to know how long this particular returned unit was in the field. One way to organize the data as it becomes available is in a Nevada chart. The name is because the resulting table has a triangle shape reminiscent of the lower part of Nevada’s shape. The chart is constructed with the count the number of failures per month and log the count by month of its shipment.
Shippment & Field data
Shippment & Field data
Shippment & Field data
From the table above, in January, we shipped 5,357 units and 3 from that group returned in January, and another 6 in February, with 5 more in March. We also received 7 returns in February and 9 in March from the batch of February shipments. Notice the shape of the table of return counts looks like Nevada.
Shippment & Field data
Graph 1 – Weibull plot
This chart is only for gathering the data. It is difficult to make any conclusion simply based on this table of data. What we do need to calculate from this data is how long the units returned were in the field and how many haven’t failed yet. This is the necessary information to perform distributional analysis such as Weibull. From this analysis we can understand trends in the data and predict how future returns will occur over time.
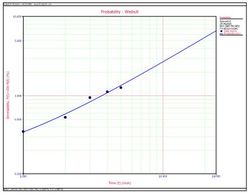
Using the data from the above example the Warranty Analysis tool within Reliasoft’s Weibull++ was used to create the Weibull chart in Graph 1.
Graph 1 – Weibull plot
Graph 1 – Weibull plot
Graph 1 – Weibull plot

Graph 1 – Weibull plot
From this graph we can see several important things about the failure distribution of this item. First there were a total of 180 failures and 20,340 items that have not failed. We can see that the Weibull distribution is a good statistical fit for the data with a Rho of 98.8%. The distribution parameters of Eta or the location parameter is 289 months and the Beta or shape parameter is 1.08 a roughly random failure rate.
Graph 1 – Weibull plot
We can also estimate the cumulative failure rates using the quick calculation pad tool within Weibull++. Below we can see that the expected cumulative failure probabilities are 3.27% for the first 12 months and 6.67% for the first 24 months. These is very useful information when you are estimating repair costs or trying to plan for spare parts.
Copyright © 2023 MTBFReport.com - All Rights Reserved.
Powered by GoDaddy